Dashboard
Overview and purpose of the dashboard
The purpose of the dashboard is to allow CET units to visualise the different types of data related to CET, which includes the following:
- SSG Grant Utilisation
- Enrolment Trends
- Course Quality
- Sectoral Demand
- Alumni Enrolment data
The dashboard pulls data from various internal sources and external sources such as:
- Internal
- L3AP
- EduRec
- Alumni Database
- External
- SSG Sectoral Demand Data
- TRAQOM Course Quality Data
The dashboard is updated on a monthly basis.
Course Funding Eligibility

The grant & compliance tab provides an overview of the current state of the CET units’ grant allocation, including the total utilization and grant balance.
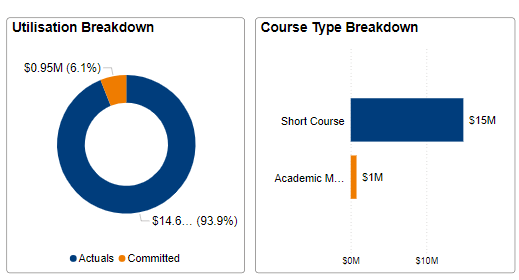
The utilization breakdown shows the percentage of the actual grant used by the CET units as compared to the committed grant. The course type breakdown shows the amount of grant used as per the type of course.
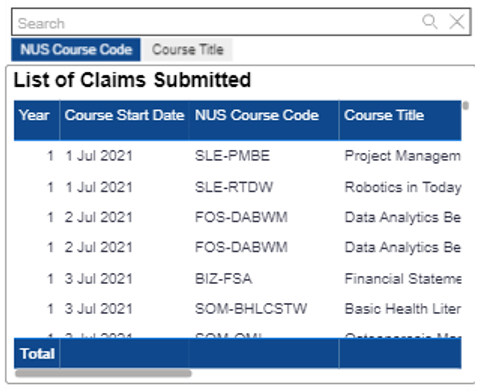
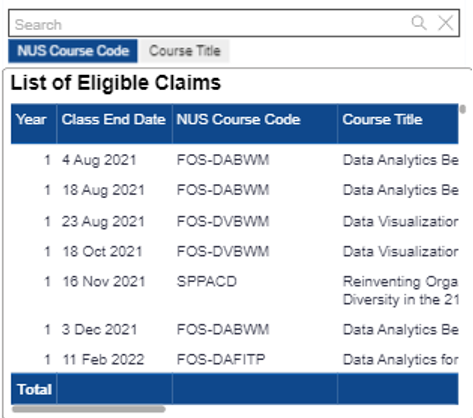
The dashboard also includes a list of claims submitted and a list of eligible claims that CET units can use to refer to both their past and any pending claims.
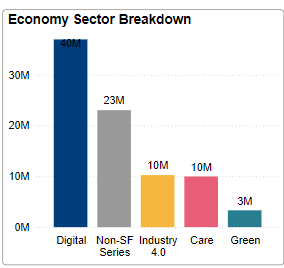
The economy sector data provides the CET units with information on the economy sector that your courses focus on.
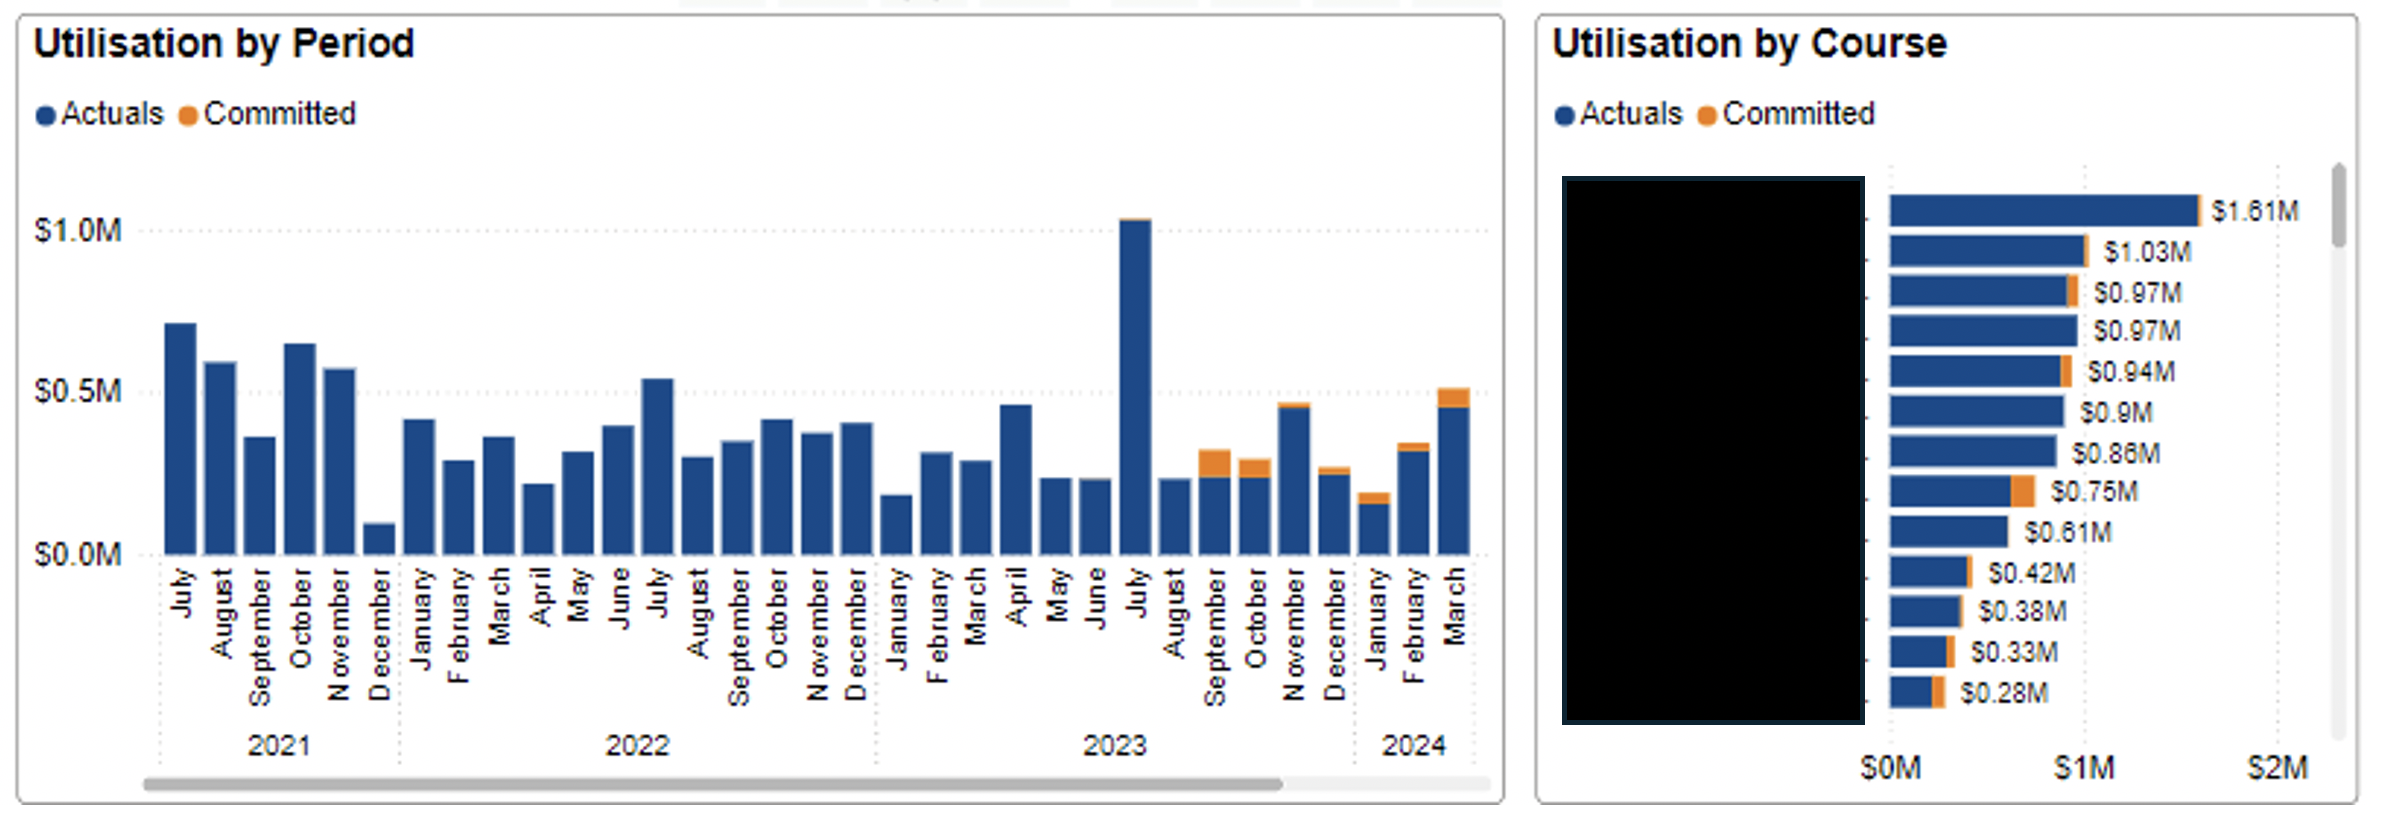
This section below shows the utilization of grant by period and by course.
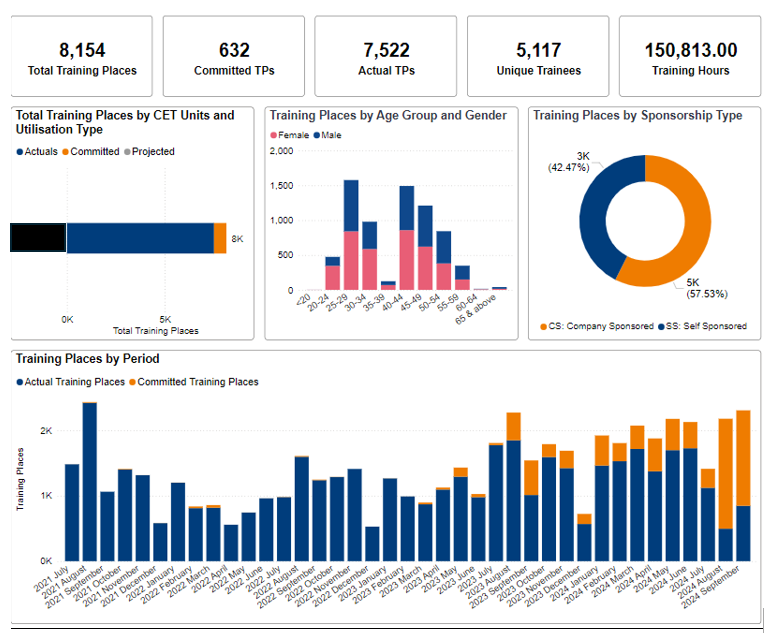
Enrolment Trending
This tab focuses on providing a breakdown of training places by utilization type, demographics, sponsorship and the enrolment trend over a grant period.
Course Quality Tab
CET units can filter the data according to the following parameters:
- Year
- Utilisation Type
- Type of Course
- Economy Sector
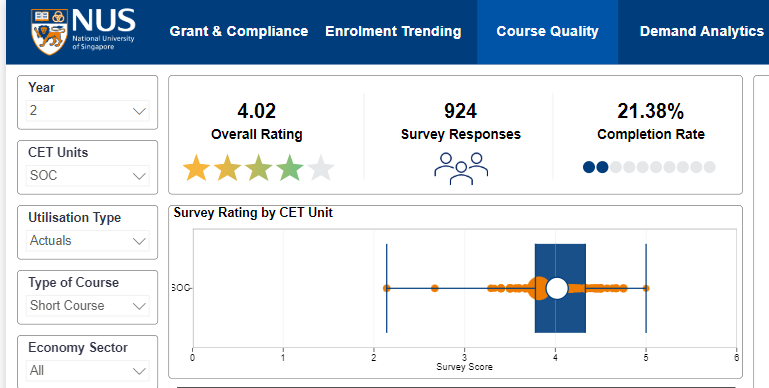
The dashboard provides an overview of the average rating of all the CET units’ courses, the total number of survey responses and the completion rate of your TRAQOM surveys.

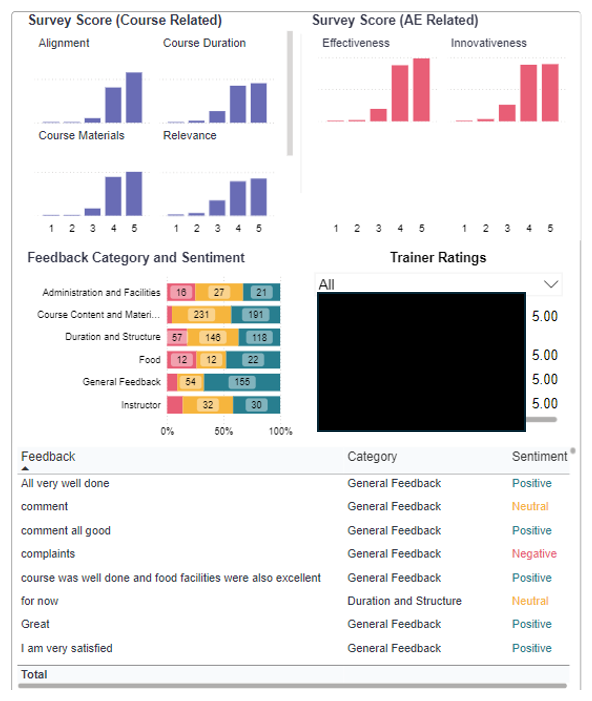
The dashboard provides detailed information on the survey score ratings for both course and trainer. There is also a breakdown of ratings by trainer provided. The qualitative feedback provided by the participants are also classified into different categories and sentiments, providing CET units with a better understanding of the feedback.
CET units can also select or search for a specific course to view the overall course quality data for that particular course. The full line data can be extracted in the Detailed Data Report tab
Demand Analytics
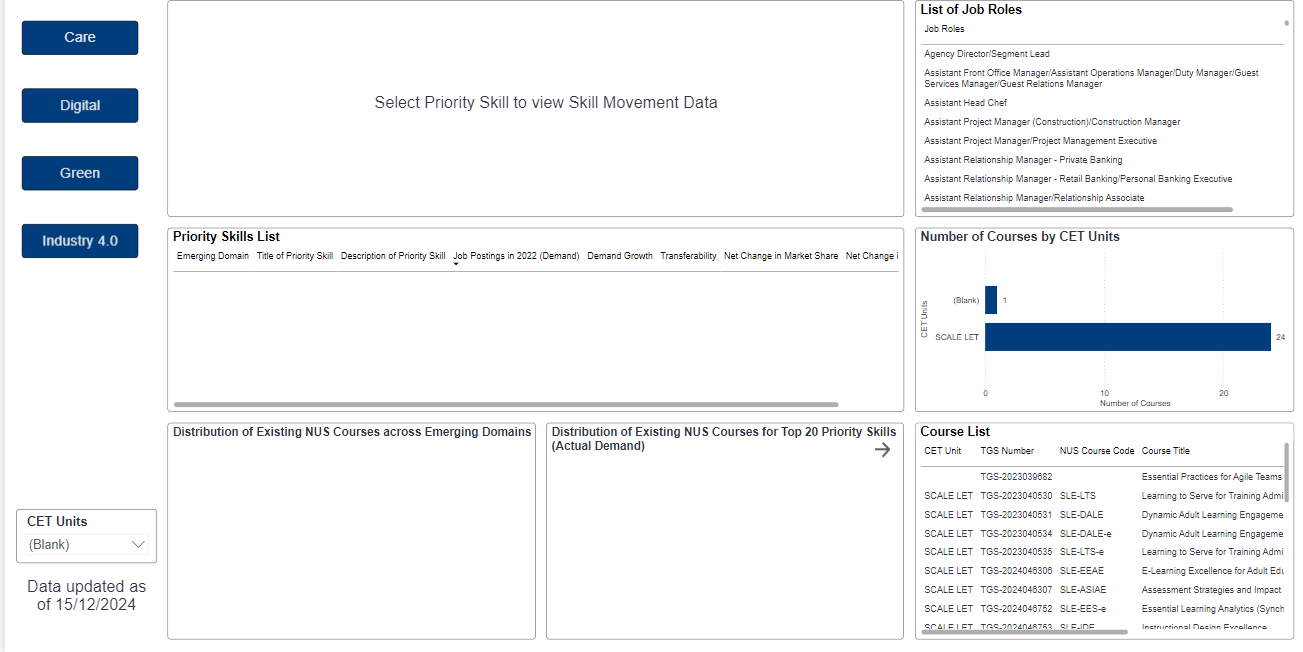
The Demand Analytics Dashboard focuses on the Priority Skills List, which shows the demand and demand growth of each priority skill identified by SSG. The dashboard also provides an overview of the total number of current courses in NUS that have been tagged to the particular priority skill. CET units can synthesize the demand and supply information and guide you in the curation of new courses.
Alumni L3 Analytics
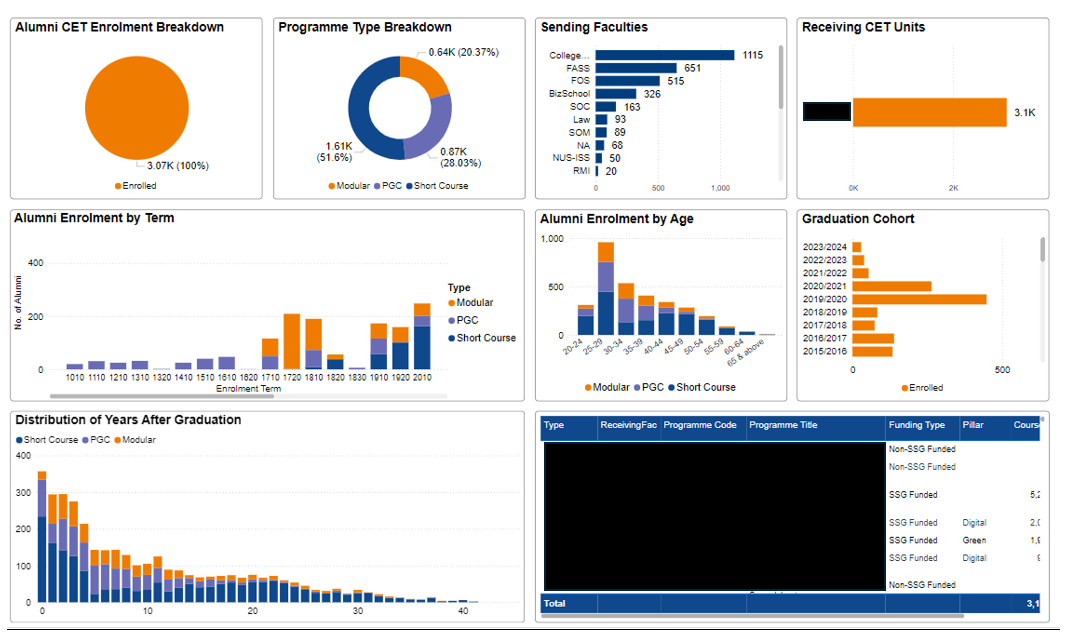
The Alumni Analytics tab breaks down the alumni participants’ population into programme type, enrolment by term, age and graduation cohort. This also shows the distribution of years after graduation that alumni have taken up courses with your unit.
Costing Template
Detailed Data Report tab
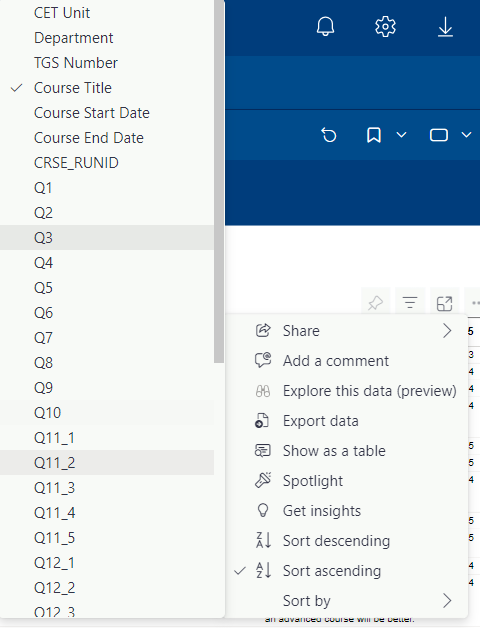
This dashboard allows CET units to view the raw data used in the grant utilisation and course quality tabs. This raw data can then be exported in Excel for further filtering and analysis.
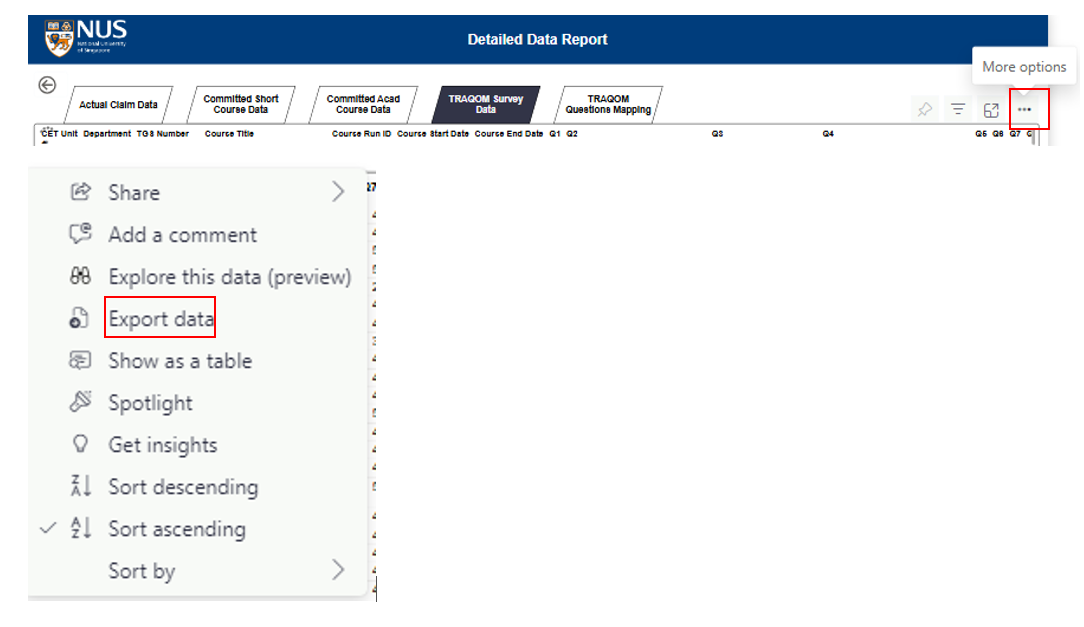
CET units can sort the data according to the course title and TGS number and export the necessary data.
